
Mathematics, 27.02.2021 19:40 fatherbamboo
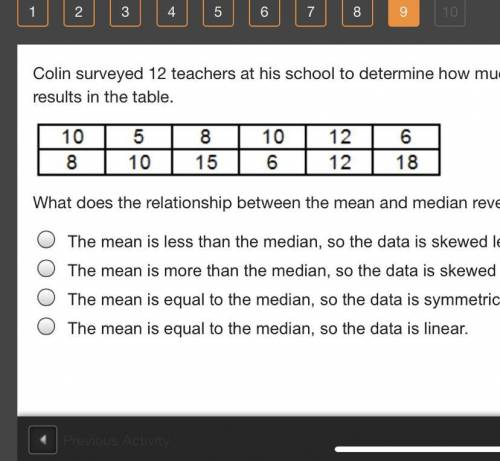
Colin surveyed 12 teachers at his school to determine how much each person budgets for lunch. He recorded his results in the table.
A 6-column table with 2 rows. The first row contains entries 10, 5, 8, 10, 12, 6. The second row contains entries 8, 10, 15, 6, 12, 18.
What does the relationship between the mean and median reveal about the shape of the data?
The mean is less than the median, so the data is skewed left.
The mean is more than the median, so the data is skewed right.
The mean is equal to the median, so the data is symmetrical.
The mean is equal to the median, so the data is linear.

Answers: 3


Other questions on the subject: Mathematics
Mathematics, 21.06.2019 14:00, zariasimone2
What is the slope of a line that is perpendicular to y = 3x + 1
Answers: 1
Mathematics, 21.06.2019 19:00, PastelHibiscus
Which equation represents the function on the graph?
Answers: 1
You know the right answer?
Colin surveyed 12 teachers at his school to determine how much each person budgets for lunch. He rec...
Questions in other subjects:
Mathematics, 14.01.2021 17:50
Mathematics, 14.01.2021 17:50


Arts, 14.01.2021 17:50
Mathematics, 14.01.2021 17:50


