
Mathematics, 27.02.2021 01:00 nicollexo21
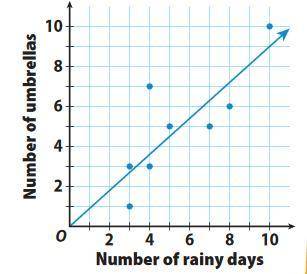
The scatter plot and trend line show the relationship between the number of rainy days in a month and the number of umbrellas sold each month. Write an equation for the trend line. Use the trend line to predict about how many rainy days are in a month if 8 umbrellas were sold.

Answers: 1


Other questions on the subject: Mathematics
Mathematics, 21.06.2019 20:50, kidpryo1
There are three bags: a (contains 2 white and 4 red balls), b (8 white, 4 red) and c (1 white 3 red). you select one ball at random from each bag, observe that exactly two are white, but forget which ball came from which bag. what is the probability that you selected a white ball from bag a?
Answers: 1
Mathematics, 21.06.2019 23:30, kreshnikolloma
Which of these angles are complementary? a. 45o and 45o b. 63o and 117o c. 45o and 135o d. 90o and 45o
Answers: 1
Mathematics, 21.06.2019 23:40, christinasmith9633
30 ! the graph shows the number of siblings different students have. select from the drop-down menus to correctly complete the statement.
Answers: 1
You know the right answer?
The scatter plot and trend line show the relationship between the number of rainy days in a month an...
Questions in other subjects:

Biology, 19.04.2021 17:30
Mathematics, 19.04.2021 17:30

Mathematics, 19.04.2021 17:30

Mathematics, 19.04.2021 17:30
Mathematics, 19.04.2021 17:30


