(Graph is in attachment)
Which variable did you plot on the x-axis, and which variable d...

Mathematics, 26.02.2021 19:00 Ciarrathereal
(Graph is in attachment)
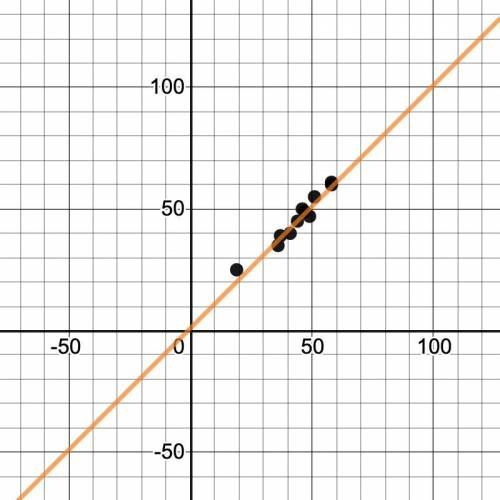
Which variable did you plot on the x-axis, and which variable did you plot on the y-axis? Explain why you assigned the variables in that way.
Write the equation of the line of best fit using the slope-intercept formula y = mx + b. Show all your work, including the points used to determine the slope and how the equation was determined.
What does the slope of the line represent within the context of your graph? What does the y-intercept represent?
Test the residuals of two other points to determine how well the line of best fit models the data.
Use the line of best fit to help you to describe the data correlation.
Using the line of best fit that you found in Part Three, Question 2, approximate how tall is a person whose arm span is 66 inches?
According to your line of best fit, what is the arm span of a 74-inch-tall person?
CHART:
Arm Span (inches)
58
49
51
19
37
44
47
36
41
46
58
Height (inches)
60
47
55
25
39
45
49
35
40
50
61

Answers: 1


Other questions on the subject: Mathematics
Mathematics, 21.06.2019 13:30, queenkimm26
Which is the product of 58 and 1,000? a. 0.058 b. 5,800 c. 58,000 d. 580,000
Answers: 1
Mathematics, 21.06.2019 15:30, dessssimartinez6780
Name these type of angles shown check all that applies
Answers: 2
Mathematics, 21.06.2019 19:00, dfrtgyuhijfghj4794
Since opening night, attendance at play a has increased steadily, while attendance at play b first rose and then fell. equations modeling the daily attendance y at each play are shown below, where x is the number of days since opening night. on what day(s) was the attendance the same at both plays? what was the attendance? play a: y = 8x + 191 play b: y = -x^2 + 26x + 126 a. the attendance was never the same at both plays. b. the attendance was the same on day 5. the attendance was 231 at both plays on that day. c. the attendance was the same on day 13. the attendance was 295 at both plays on that day. d. the attendance was the same on days 5 and 13. the attendance at both plays on those days was 231 and 295 respectively.
Answers: 1
Mathematics, 22.06.2019 02:30, lisnel
Aconstruction worker needs to put a rectangular window in the side of a building he knows from measuring that the top and bottom of the window have a width of 8bfeet and the sides have a length of 15 feet he also measured one diagonal to be 17 feet what is the length of the other diagonal
Answers: 1
You know the right answer?
Questions in other subjects:

Biology, 10.07.2019 03:20
Mathematics, 10.07.2019 03:20

Mathematics, 10.07.2019 03:20

Mathematics, 10.07.2019 03:20


