
Mathematics, 26.02.2021 18:20 alethhaaa
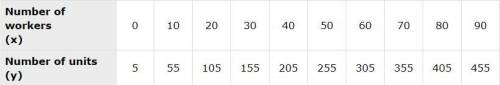
A student is assessing the correlation between the number of workers in a factory and the number of units produced daily. The table below shows the data:
Part A: Is there any correlation between the number of workers in a factory and the number of units produced daily? Justify your answer.
Part B: Write a function which best fits the data.
Part C: What does the slope and y-intercept of the plot indicate?

Answers: 1


Other questions on the subject: Mathematics
Mathematics, 21.06.2019 16:00, lil8174
Which term best describes the association between variables a and b? no association a negative linear association a positive linear association a nonlinear association a scatterplot with an x axis labeled, variable a from zero to ten in increments of two and the y axis labeled, variable b from zero to one hundred forty in increments of twenty with fifteen points in a positive trend.
Answers: 3
Mathematics, 21.06.2019 18:00, WonTonBagel
You paid 28.00 for 8 gallons of gasoline. how much would you pay for 15 gallons of gasoline?
Answers: 1
Mathematics, 21.06.2019 19:00, kayranicole1
The weekly revenue for a company is r = 3p^2 + 60p + 1060, where p is the price of the company's product. what price will result in a revenue of $1200.
Answers: 1
You know the right answer?
A student is assessing the correlation between the number of workers in a factory and the number of...
Questions in other subjects:


Mathematics, 10.07.2019 17:00


Biology, 10.07.2019 17:00
Chemistry, 10.07.2019 17:00


