
Mathematics, 26.02.2021 17:10 mallardmya2006
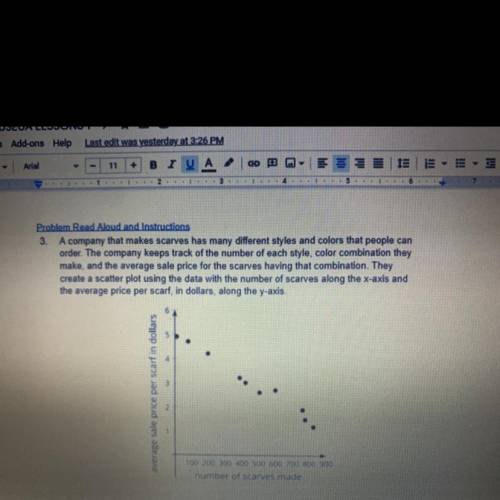
Q3.1) The data in the graph suggest a linear association. Which of the functions best
represents the equation of the line of best fit?
A y = -225x + 1,124
B. y = -0.004x + 5
C y = -x + 5
D. y = 0.01x + 5
A3.1) Put your multiple choice answer here:
Q32) What is the slope and what does it represent in this situation?
A3 2) Put the slope and what it means here
na copy of your
T Loading Microsoft ...
Zoom

Answers: 3


Other questions on the subject: Mathematics
Mathematics, 21.06.2019 23:00, johnsonkia873
Find the rate at which the water is now flowing from the tap give your answer cubic centimetres per second
Answers: 1
Mathematics, 22.06.2019 01:30, cpulls189
Cherie works in retail and her weekly salary includes commission for the amount she sells. the equation s=400+0.15c models the relation between her weekly salary, s, in dollars and the amount of her sales, c, in dollars. interpret the slope of the equation.
Answers: 3
Mathematics, 22.06.2019 01:50, lcyaire
Me asap the graph shows the relationship between the price of frozen yogurt and the number of ounces of frozen yogurt sold at different stores and restaurants according to the line of best fit about how many ounces of frozen yogurt can someone purchase for $5? 1 cost of frozen yogurt 1.5 2 13 15.5 cost (5) no 2 4 6 8 10 12 14 16 18 20 size (oz)
Answers: 1
You know the right answer?
Q3.1) The data in the graph suggest a linear association. Which of the functions best
represents...
Questions in other subjects:


