
Mathematics, 26.02.2021 03:40 izhaneedwards
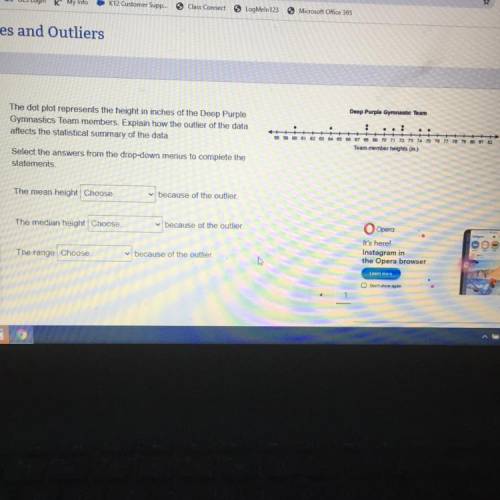
The dot plot represents the height in inches of the Deep Purple
Gymnastics Team members. Explain how the outlier of the data
affects the statistical summary of the data.
Select the answers from the drop-down menus to complete the
statements.
The mean height Choose...
because of the outlier.
The median height Choose...
because of the outlier.
The range Choose...
because of the outlier.

Answers: 3


Other questions on the subject: Mathematics
Mathematics, 21.06.2019 14:20, christingle2004
Ac contractor is building a new subdivision outside of the city. he has started work on the first street and is planning on the other streets to run in a direction parallel to the first. the second street will pass through (-2,4) find the equation of the location of the second street in standard form. a.2x+y=2 b. x-y=2 c.2x+y=2 d. x+y=2
Answers: 2
You know the right answer?
The dot plot represents the height in inches of the Deep Purple
Gymnastics Team members. Explain ho...
Questions in other subjects:
Mathematics, 27.01.2021 23:20


Computers and Technology, 27.01.2021 23:20
Mathematics, 27.01.2021 23:20
Mathematics, 27.01.2021 23:20

English, 27.01.2021 23:20


