
Mathematics, 25.02.2021 21:20 Brightcord9679
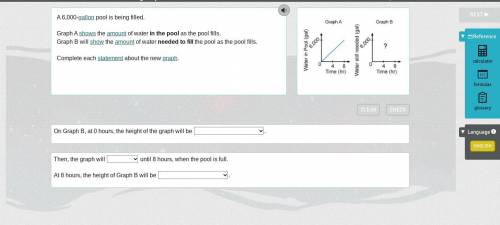
A 6,000-gallon pool is being filled.
Graph A shows the amount of water in the pool as the pool fills.
Graph B will show the amount of water needed to fill the pool as the pool fills.
Complete each statement about the new graph.
On Graph B, at 0 hours, the height of the graph will be
at 0 gallons
at 3000 gallons
at 6000 gallons
Then, the graph will
increase, decrease, or stay level
until 8 hours, when the pool is full.
At 8 hours, the height of Graph B will be at
0 gallons
3000 gallons
6000 gallons

Answers: 3


Other questions on the subject: Mathematics
Mathematics, 21.06.2019 15:20, lambobacon9027
Classify the following triangle check all that apply
Answers: 2
Mathematics, 21.06.2019 17:30, scoutbuffy2512
How do you use the elimination method for this question? explain, because i really want to understand!
Answers: 1
Mathematics, 21.06.2019 19:00, cheryljoseph69
Sanya noticed that the temperature was falling at a steady rate of 1.4 degrees every hour from the time that she first checked her outdoor thermometer. by 6 a. m., the temperature had fallen 21 degrees. which expression can you use to find how many hours earlier she had first checked the thermometer?
Answers: 3
Mathematics, 21.06.2019 19:30, keidyhernandezm
James was playing a game with his friends. he won 35 points. then he lost 15, lost 40 and won 55. how did he come out
Answers: 2
You know the right answer?
A 6,000-gallon pool is being filled.
Graph A shows the amount of water in the pool as the pool fill...
Questions in other subjects:


Mathematics, 18.09.2021 23:00


