
Mathematics, 25.02.2021 09:10 sharperenae7274
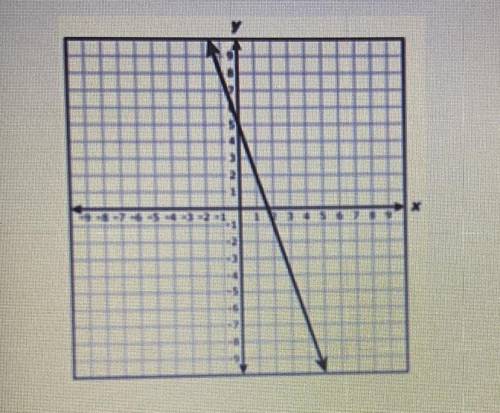
The graph of a linear relationship is shown on the grid. Which equation is the best represented by the graph?
A. Y-4=3(x+7)
B. Y-2=3(x-1)
C. Y+1=-3(x-2)
D. Y+10=-3(x-4)

Answers: 2


Other questions on the subject: Mathematics
Mathematics, 21.06.2019 15:00, maehardy4134
The water has been on the stove y=9.5x+62.1 after how many minutes will the tempature be 138.1 f
Answers: 1
Mathematics, 21.06.2019 18:50, beeboppity
7. the area of the playing surface at the olympic stadium in beijing isof a hectare. what area will it occupy on a plan drawn to a scaleof 1: 500?
Answers: 3
Mathematics, 21.06.2019 20:00, beverlyamya
Three baby penguins and their father were sitting on an iceberg 0.50.50, point, 5 meters above the surface of the water. the father dove down 4.74.74, point, 7 meters from the iceberg into the water to catch dinner for his kids. what is the father penguin's position relative to the surface of the water?
Answers: 2
Mathematics, 21.06.2019 21:50, zymikaa00
Scores on a university exam are normally distributed with a mean of 78 and a standard deviation of 8. the professor teaching the class declares that a score of 70 or higher is required for a grade of at least “c.” using the 68-95-99.7 rule, what percentage of students failed to earn a grade of at least “c”?
Answers: 1
You know the right answer?
The graph of a linear relationship is shown on the grid. Which equation is the best represented by t...
Questions in other subjects:


History, 01.10.2019 21:30

History, 01.10.2019 21:30

Mathematics, 01.10.2019 21:30


