
Mathematics, 25.02.2021 08:20 tiffanyheist
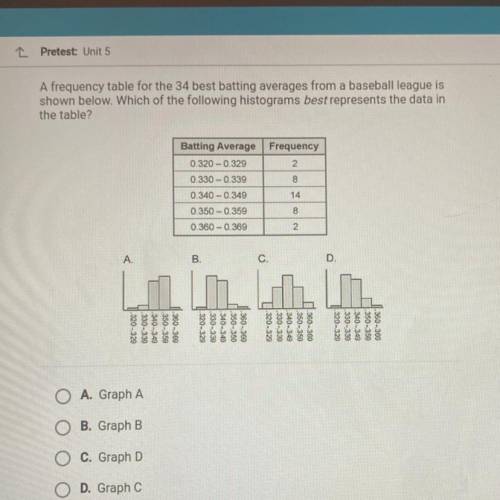
A frequency table for the 34 best batting averages from a baseball league is
shown below. Which of the following histograms best represents the data in
the table?
Frequency
2
Batting Average
0.320 -0.329
0.330 -0.339
0.340 -0.349
0.350 - 0.359
0.360 -0.369
0000
A.
B.
C.
.320-329
-330-339
1.340-349
.350-350
360-360
320-329
:330-339
.340-349
.350-359
.360-360
.320-329
-330-339
.340-349
.350 - 350
.360-360
-320-320
.330-339
340-349
350-350
.360-369
A. Graph A
B. Graph B
C. Graph D
O D. Graph C

Answers: 1


Other questions on the subject: Mathematics
Mathematics, 21.06.2019 18:30, Karinaccccc
Astick 2 m long is placed vertically at point b. the top of the stick is in line with the top of a tree as seen from point a, which is 3 m from the stick and 30 m from the tree. how tall is the tree?
Answers: 2
Mathematics, 21.06.2019 22:30, rubycarbajal
The area of a circle is equal to 1 dm². find the radius of the circle.
Answers: 1
You know the right answer?
A frequency table for the 34 best batting averages from a baseball league is
shown below. Which of...
Questions in other subjects:
Mathematics, 11.07.2019 22:00
Mathematics, 11.07.2019 22:00

English, 11.07.2019 22:00

Biology, 11.07.2019 22:00


