
Mathematics, 25.02.2021 07:10 carlo123
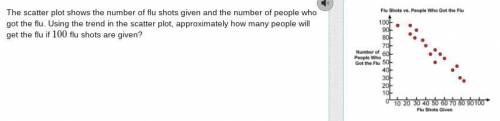
The scatter plot shows the number of flu shots given and the number of people who got the flu. Using the trend in the scatter plot, approximately how many people will get the flu if 100 flu shots are given?

Answers: 1


Other questions on the subject: Mathematics
Mathematics, 21.06.2019 22:40, zafarm2oxgpmx
Identify this conic section. x2 - y2 = 16 o line circle ellipse parabola hyperbola
Answers: 2
You know the right answer?
The scatter plot shows the number of flu shots given and the number of people who got the flu. Using...
Questions in other subjects:

English, 04.12.2019 21:31
Mathematics, 04.12.2019 21:31

Biology, 04.12.2019 21:31
Mathematics, 04.12.2019 21:31


