This table shows the profit for a company (in millions of dollars) in different
years.
...

Mathematics, 25.02.2021 03:40 xojade
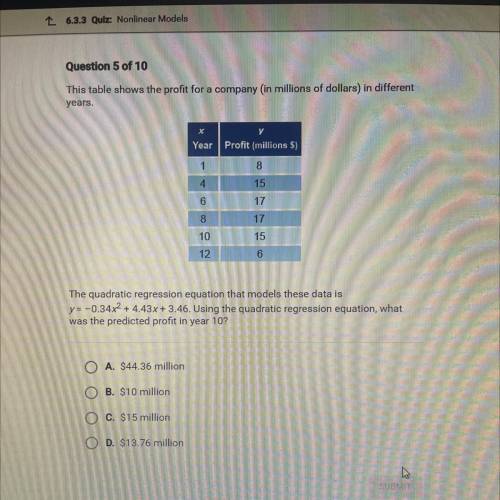
This table shows the profit for a company (in millions of dollars) in different
years.
The quadratic regression equation that models these data is
y=-0.34x2 + 4.43x + 3.46. Using the quadratic regression equation, what
was the predicted profit in year 10?
A. $44.36 million
B. $10 million
C. $15 million
D. $13.76 million

Answers: 1


Other questions on the subject: Mathematics
Mathematics, 21.06.2019 15:20, lizziesuks
At the newest animated movie, for every 9 children, there are 4 adults. there are a total of 39 children and adults at the movie.
Answers: 2
Mathematics, 21.06.2019 18:00, MayFlowers
Name each raycalculation tip: in ray "ab", a is the endpoint of the ray.
Answers: 1
You know the right answer?
Questions in other subjects:


