
Mathematics, 24.02.2021 22:30 mathman2428
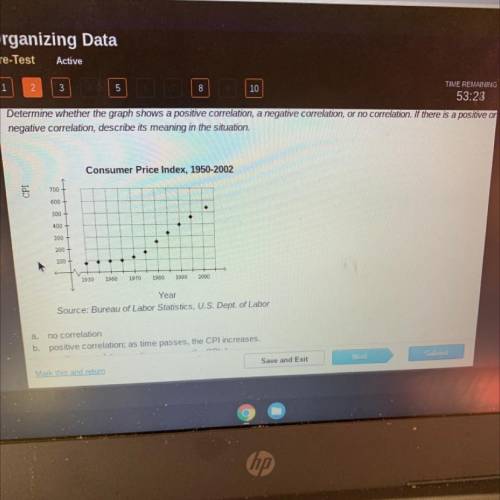
HURRY ANSWER Determine whether the graph shows a positive correlation, a negative correlation, or no correlation. If there is a positive on
negative correlation, describe its meaning in the situation.
Consumer Price Index, 1950-2002
700
600+
500
400
300
200+
100
1950
1960
1970
1980
1990
2000
Year
Source: Bureau of Labor Statistics, U. S. Dept. of Labor
a. no correlation
b. positive correlation; as time passes, the CPI increases.
C. positive correlation as time passes

Answers: 1


Other questions on the subject: Mathematics
Mathematics, 21.06.2019 15:30, kaelyynn752
Iwill give brainliest only if your correct the words subsequent and submerge both contain the prefix sub. based on this information, what does the prefix sub most likely mean? a) under or secondary b) true or verifiable c) tricky or difficult d) around or centered on
Answers: 1
Mathematics, 21.06.2019 18:20, ellenharley7
What value of x is in the solution set of 4x - 12 s 16 + 8x? -10 -9 -8 -7
Answers: 1
You know the right answer?
HURRY ANSWER Determine whether the graph shows a positive correlation, a negative correlation, or no...
Questions in other subjects:


Mathematics, 05.10.2019 10:30
Mathematics, 05.10.2019 10:30
English, 05.10.2019 10:30

Spanish, 05.10.2019 10:30
Mathematics, 05.10.2019 10:30


