
Mathematics, 24.02.2021 22:10 katswindle11
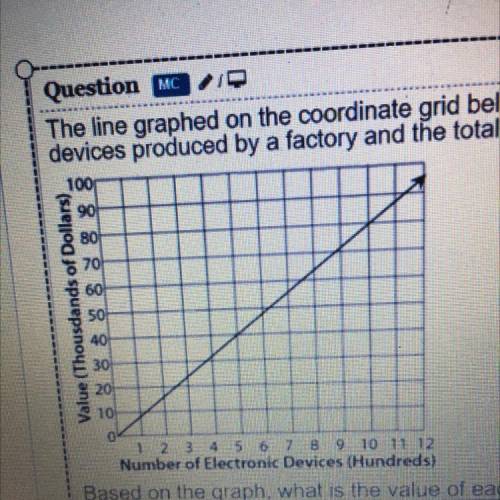
The line graphed on the coordinate grid below shows the relationship between the number of electronic devices produced by a factory and the total value of the devices. Based on the graph, what is the value of each electronic device?

Answers: 3


Other questions on the subject: Mathematics
Mathematics, 21.06.2019 23:30, jtroutt74
Afactory buys 10% of its components from suppliers b and the rest from supplier c. it is known that 6% of the components it buys are faulty. of the components brought from suppliers a,9% are faulty and of the components bought from suppliers b, 3% are faulty. find the percentage of components bought from supplier c that are faulty.
Answers: 1
You know the right answer?
The line graphed on the coordinate grid below shows the relationship between the number of electroni...
Questions in other subjects:


Social Studies, 20.07.2019 23:00


History, 20.07.2019 23:00


Business, 20.07.2019 23:00


