
Mathematics, 24.02.2021 20:00 libi052207
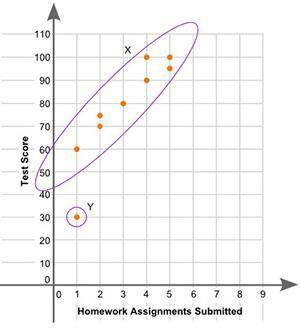
06.01)The scatter plot shows the relationship between the number of homework assignments turned in over a week and the test score for that same week:
A scatter plot is shown. The x-axis is labeled Homework Assignments Submitted and the y-axis is labeled test score. Data points are located at 1 and 30, 2 and 70, 2 and 75, 3 and 80, 5 and 100, 4 and 100, 4 and 90, 5 and 95, and 1 and 60. A circle labeled X surrounds all of the points except 1 and 30. The point 1 and 30 is labeled Y.
Part A: What is the group of points labeled X called? What is the point labeled Y called? Give a possible reason for the presence of point Y. (3 points)
Part B: Describe the association between a student’s test scores and the number of homework assignments submitted. (2 points)

Answers: 2


Other questions on the subject: Mathematics
Mathematics, 21.06.2019 14:00, jannaleigh
Jackie bought a bag of oranges. she used 3/8 of the oranges to make orange juice. she used 1/3 of the oranges to make a fruit salad. she put 1/8 of the oranges in a bowl on the table. she put 2/12 of the oranges in the refrigerator. a) jackie left more oranges on the table than she put in the refrigerator. b) jackie used fewer oranges to make orange juice than she left on the table. c) jackie put fewer oranges in the refrigerator than she used to make the fruit salad. eliminate d) jackie used more oranges to make a fruit salad than she used to make orange juice.
Answers: 1
Mathematics, 21.06.2019 21:00, lunnar2003
Graph the system of inequalities presented here on your own paper, then use your graph to answer the following questions: y < 4x − 8 y is greater than or equal to negative 5 over 2 times x plus 5 part a: describe the graph of the system, including shading and the types of lines graphed. provide a description of the solution area. (6 points) part b: is the point (5, −8) included in the solution area for the system? justify your answer mathematically. (4 points)
Answers: 3
Mathematics, 21.06.2019 22:50, 7obadiah
He graph of f(x) = |x| is stretched by a factor of 0.3 and translated down 4 units. which statement about the domain and range of each function is correct? the range of the transformed function and the parent function are both all real numbers greater than or equal to 4. the domain of the transformed function is all real numbers and is, therefore, different from that of the parent function. the range of the transformed function is all real numbers greater than or equal to 0 and is, therefore, different from that of the parent function. the domain of the transformed function and the parent function are both all real numbers.
Answers: 3
Mathematics, 21.06.2019 23:00, lizbethmillanvazquez
Apackage of orgainc strwberries costs $1.50 while there in season and $2.25 when not in season what the percent increase
Answers: 1
You know the right answer?
06.01)The scatter plot shows the relationship between the number of homework assignments turned in o...
Questions in other subjects:
Mathematics, 28.01.2020 06:31


Computers and Technology, 28.01.2020 06:31

Mathematics, 28.01.2020 06:31

History, 28.01.2020 06:31
Mathematics, 28.01.2020 06:31

Biology, 28.01.2020 06:31
Mathematics, 28.01.2020 06:31


