
Mathematics, 24.02.2021 19:30 emmeaw245
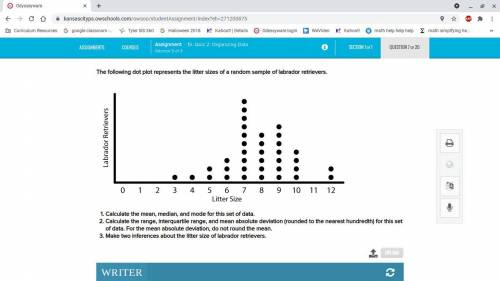
Plz help wrong answers will be reported The following dot plot represents the litter sizes of a random sample of Labrador retrievers.
Calculate the mean, median, and mode for this set of data.
Calculate the range, quarterfinal range, and mean absolute deviation (rounded to the nearest hundredth) for this set of data. For the mean absolute deviation, do not round the mean.
look at the screenshot number line it will help i know you can not read the words in the screenshot so i put them in here up above
Make two inferences about the litter size of Labrador retrievers.

Answers: 1


Other questions on the subject: Mathematics
Mathematics, 21.06.2019 20:00, tansebas1107
Can you me find the missing length. i attached an image.
Answers: 1
Mathematics, 21.06.2019 20:00, michelle5642b
Find all solutions for 2y - 4x =2 y = 2x + 1 site: socratic. org
Answers: 1
Mathematics, 22.06.2019 00:00, christeinberg1
An equation in slope-intersept form the lines that passes thought (-8,1) and is perpindicular to the y=2x-17.
Answers: 1
You know the right answer?
Plz help wrong answers will be reported The following dot plot represents the litter sizes of a rand...
Questions in other subjects:

Spanish, 21.03.2020 02:46

Spanish, 21.03.2020 02:46


Mathematics, 21.03.2020 02:47


