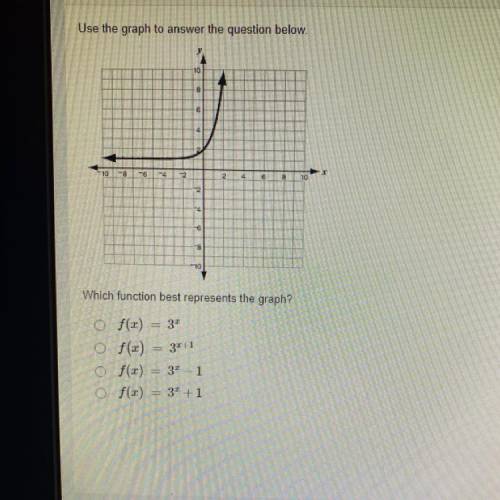
Use the graph to answer the question below.
Which function best represents the graph?
Of(x) =...

Mathematics, 24.02.2021 18:30 Science2019
Use the graph to answer the question below.
Which function best represents the graph?
Of(x) = 32
Of(x)31
O f() = 31 - 1
Of(x) = 3 + 1

Answers: 1


Other questions on the subject: Mathematics
Mathematics, 21.06.2019 14:50, MysteryDove12
What is f(3) for the quadratic functionf(x)=2x2 + x – 12? f -3g 3h 6i. 9
Answers: 1
Mathematics, 21.06.2019 22:30, patrickfryer240
When i'm with my factor 5, my prodect is 20 .when i'm with my addend 6' my sum is 10.what number am i
Answers: 1
You know the right answer?
Questions in other subjects:

Arts, 17.12.2019 17:31
Mathematics, 17.12.2019 17:31

Biology, 17.12.2019 17:31


