
Mathematics, 24.02.2021 18:10 LJ710
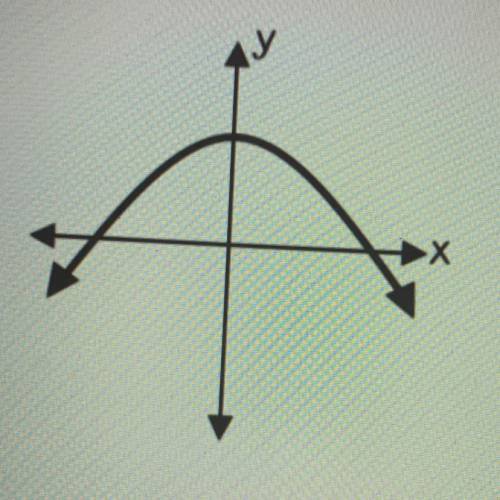
Does the graph below represent a function? How do you know?
No. Each input only has one output.
Yes. Each input would have more than one output.
Yes. The graph does not pass the vertical line test.
Yes. The graph passes the vertical line test.

Answers: 3


Other questions on the subject: Mathematics
Mathematics, 21.06.2019 19:00, brighamc23
Draw a scaled copy of the circle using a scale factor of 2
Answers: 1
Mathematics, 21.06.2019 19:30, thebasedgodchri
Boris needs to buy plastic spoons. brand a has a box 42 spoons for $2.37. brand b has a box of 72 spoons for $3.57. find the unit price for each brand. then state which brand is the better buy based on the unit price. round your answer to the nearest cent.
Answers: 1
Mathematics, 21.06.2019 21:30, ajm1132005
Questions 9-10. use the table of educational expenditures to answer the questions. k-12 education expenditures population indiana $9.97 billion 6.6 million illinois $28.54 billion 12.9 million kentucky $6.58 billion 4.4 million michigan $16.85 billion 9.9 million ohio $20.23 billion 11.6million 9. if the amount of k-12 education expenses in indiana were proportional to those in ohio, what would have been the expected value of k-12 expenditures in indiana? (give the answer in billions rounded to the nearest hundredth) 10. use the value of k-12 education expenditures in michigan as a proportion of the population in michigan to estimate what the value of k-12 education expenses would be in illinois. a) find the expected value of k-12 expenditures in illinois if illinois were proportional to michigan. (give the answer in billions rounded to the nearest hundredth) b) how does this compare to the actual value for k-12 expenditures in illinois? (lower, higher, same? )
Answers: 1
You know the right answer?
Does the graph below represent a function? How do you know?
No. Each input only has one output.
Questions in other subjects:

Biology, 02.03.2020 00:35
Mathematics, 02.03.2020 00:35
Mathematics, 02.03.2020 00:35

Mathematics, 02.03.2020 00:36


