
Mathematics, 24.02.2021 09:30 laurenlol756
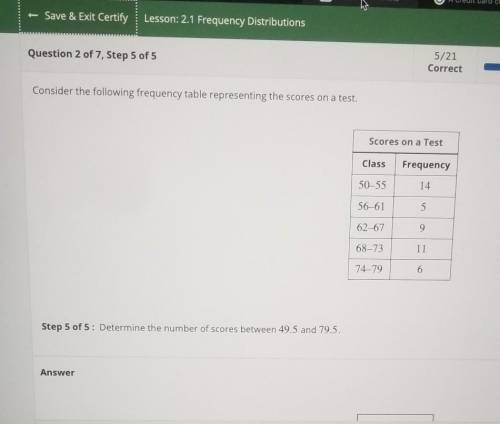
Consider the following frequency table representing the scores on a test. Scores on a Test Class Frequency 50–55 14 56-61 5 62–67 9 68-73 11 74-79 6 Step 5 of 5: Determine the number of scores between 49.5 and 79.5.

Answers: 3


Other questions on the subject: Mathematics
Mathematics, 22.06.2019 01:00, saigeshort
Pentagon abcde is dilated according to the rule do,3(x, y) to create the image pentagon a'b'c'd'e', which is shown on the graph. what are the coordinates of point a of the pre-image? a) (-1, 1)b) (-1, 2)c) (-9, 6)d) (-9, 18)
Answers: 3
You know the right answer?
Consider the following frequency table representing the scores on a test. Scores on a Test Class Fre...
Questions in other subjects:


History, 06.04.2021 01:00

Mathematics, 06.04.2021 01:00


