
Mathematics, 24.02.2021 06:20 annaharmon693
Which of the following graphs shows a pair of lines that represent the equations with a solution (−4, 3)? (5 points)
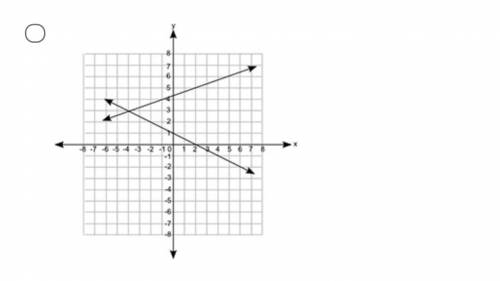
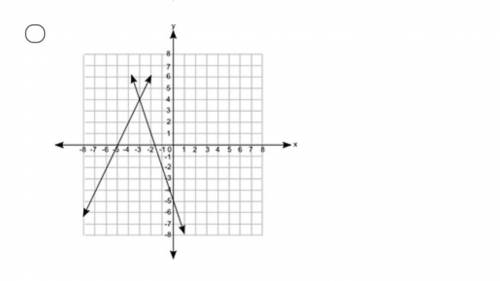
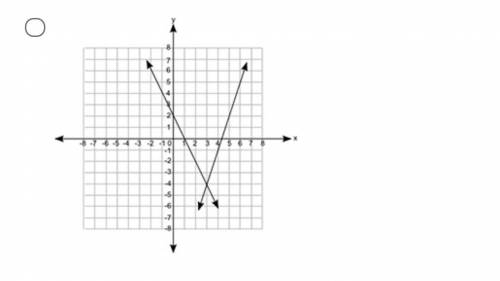
A coordinate grid is shown from negative 8 to positive 8 on the x axis and also on the y axis. A pair of lines is shown intersecting on ordered pair 4 units to the left and 3 units up.
A coordinate grid is shown from negative 8 to positive 8 on the x axis and also on the y axis. A pair of lines is shown intersecting on ordered pair 3 units to the left and 4 units up.
A coordinate grid is shown from negative 8 to positive 8 on the x axis and also on the y axis. A pair of lines is shown intersecting on ordered pair 4 units to the right and 3 units down.
A coordinate grid is shown from negative 8 to positive 8 on the x axis and also on the y axis. A pair of lines is shown intersecting on ordered pair 3 units to the right and 4 units down.


Answers: 1


Other questions on the subject: Mathematics
Mathematics, 21.06.2019 16:40, kokokakahi
Find the solutions for a triangle with a =16, c =12, and b = 63º
Answers: 3
Mathematics, 22.06.2019 00:30, ElizabethF
What is the interquartile range of this day at set?
Answers: 1
Mathematics, 22.06.2019 04:00, abigailweeks10
Ahealth-food producer has 250 samples of a new snack to distribute in the mall. the producer has to keep at least 50 samples for display in the health food for the product launch. how long will the samples last if consumers are taking the samples at a rate of 25 every hour
Answers: 2
You know the right answer?
Which of the following graphs shows a pair of lines that represent the equations with a solution (−4...
Questions in other subjects:

Health, 11.09.2021 05:50

Mathematics, 11.09.2021 06:00
Mathematics, 11.09.2021 06:00

Mathematics, 11.09.2021 06:00
Mathematics, 11.09.2021 06:00
History, 11.09.2021 06:00


