
Mathematics, 23.02.2021 18:30 jmeza502506
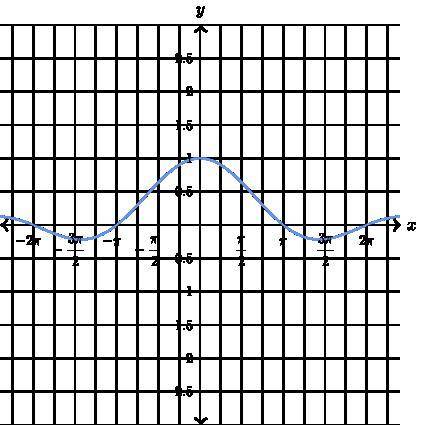
The illustration below shows the graph of y as a function of x.
Complete the following sentences based on the graph of the function.
-This is the graph of a nonlinear/linear/ or constant function
- The y-intercept of the graph is the function value y=
- The smallest positive x-intercept of the graph is located at x=
- The greatest value of y is y= /and it occurs when x=
- For x between x=π and x=2π, the function value y greater than/less than/ or equal to 0

Answers: 1


Other questions on the subject: Mathematics
Mathematics, 21.06.2019 22:20, guesswhoitis21
Line segment eg is partitioned by point f in the ratio 1: 1. point e is at e (0, 4), and point f is at (1, 3). what are the coordinates of point g? (−1, 5) (2, 2) (3, 1) (4, 0)
Answers: 2
Mathematics, 21.06.2019 23:30, xandraeden32
Consider the first four terms of the sequence below. what is the 8th term of this sequence?
Answers: 1
You know the right answer?
The illustration below shows the graph of y as a function of x.
Complete the following sentences ba...
Questions in other subjects:


Mathematics, 22.11.2019 06:31


