
Mathematics, 23.02.2021 18:20 offensiveneedle
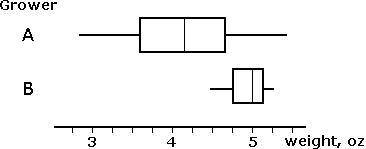
The box plots represent weights of tomatoes harvested by two growers. Based on the graph, which is true?
A. Grower A was more likely than grower B to have tomatoes weighing 5 or more ounces.
B. All grower A tomatoes were lighter than all grower B tomatoes.
C. Grower B was more likely than grower A to have tomatoes weighing 4.5 or more ounces.
D. Grower B tomatoes were more likely to weigh less than 5 ounces than they were to weigh more than 5 ounces.

Answers: 2


Other questions on the subject: Mathematics
Mathematics, 21.06.2019 21:00, cjgonzalez981
Type the correct answer in each box. use numerals instead of words. if necessary, use / fir the fraction bar(s). the graph represents the piecewise function: h
Answers: 3
Mathematics, 21.06.2019 21:30, unknowntay04
Which equation shows the variable terms isolated on one side and the constant terms isolated on the other side for the equation -1/2x+3=4-1/4x? a. -1/4x=1 b. -3/4x=1 c. 7=1/4x d. 7=3/4x
Answers: 1
Mathematics, 21.06.2019 22:00, mileto1798
Write a description of each inequality. 1. -5a + 3 > 1 2. 27 - 2b < -6 (this < has a _ under it) 3. 1/2 (c + 1) > 5 (this > has a _ under it)
Answers: 3
You know the right answer?
The box plots represent weights of tomatoes harvested by two growers. Based on the graph, which is t...
Questions in other subjects:

History, 23.07.2019 07:50

History, 23.07.2019 07:50

History, 23.07.2019 07:50


