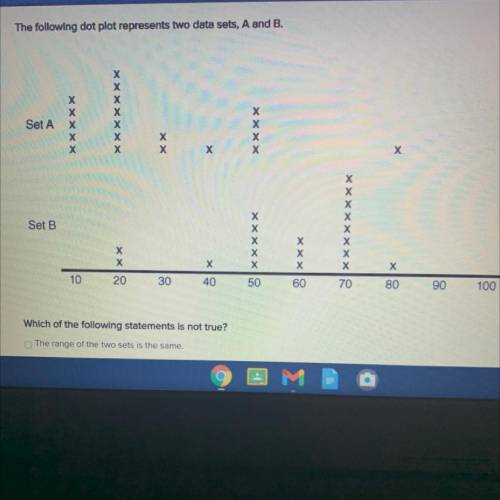
The following dot plot represents two data sets, A and B.
Х
х
х
Set A
х
х
х
х
X
х
х
X
Set B
X
X
Х
X
X
х
х
X
X
X
Х
х
Х
10
20
30
40
50
60
70
80
90
100
Which of the following statements is not true?
The range of the two sets is the same, the difference between the median of each set is 40, set b has a higher mean than set a, the mode of set a is 50 less than the mode of set b
The roof of a farm silo is the shape of a hemisphere and is made of sheet tin. if the diameter of the silo is 126.5 feet, how much sheet tin is needed to make the roof? (use π = 3.1416.)