
Mathematics, 22.02.2021 22:30 meaghan18
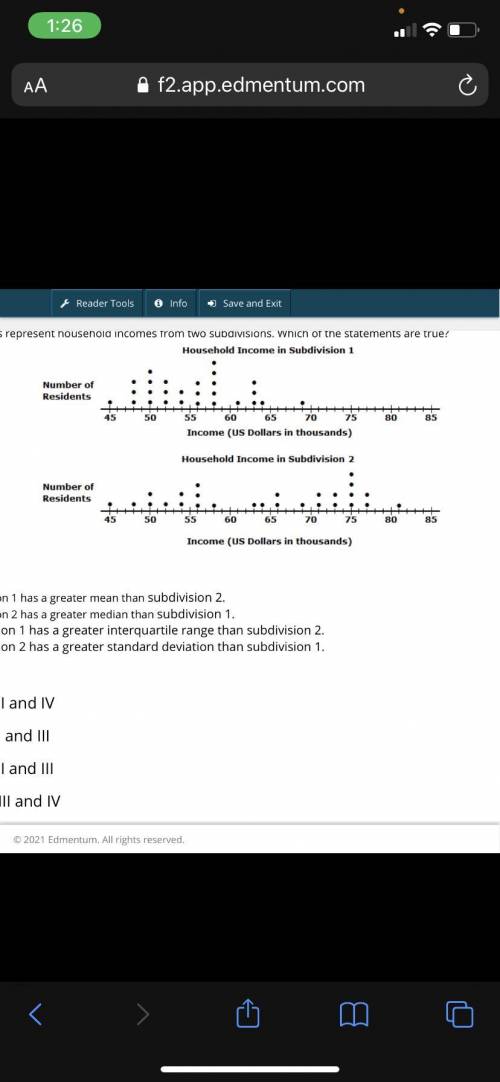
The dot plots represent household incomes from two subdivisions. Which of the statements are true? I. Subdivision 1 has a greater mean than subdivision 2. II. Subdivision 2 has a greater median than subdivision 1. III. Subdivision 1 has a greater interquartile range than subdivision 2. IV. Subdivision 2 has a greater standard deviation than subdivision 1. A. II and IV B. I and III C. II and III D. III and IV

Answers: 3


Other questions on the subject: Mathematics
Mathematics, 21.06.2019 14:00, payloo
Alex drew a circle with right triangle prq inscribed in it, as shown below: the figure shows a circle with points p, q, and r on it forming an inscribed triangle. side pq is a chord through the center and angle r is a right angle. arc qr measures 80 degrees.
Answers: 2
Mathematics, 21.06.2019 18:00, dlatricewilcoxp0tsdw
Solutions for 2x+7 less than or equal to 3x-5
Answers: 1
Mathematics, 21.06.2019 21:50, kaylaamberd
Suppose that the price p, in dollars, and the number of sales, x, of a certain item follow the equation 4 p plus 4 x plus 2 pxequals56. suppose also that p and x are both functions of time, measured in days. find the rate at which x is changing when xequals2, pequals6, and startfraction dp over dt endfraction equals1.5.
Answers: 2
You know the right answer?
The dot plots represent household incomes from two subdivisions. Which of the statements are true? I...
Questions in other subjects:


Mathematics, 24.04.2020 23:40
Mathematics, 24.04.2020 23:40


