
Mathematics, 22.02.2021 06:30 acesmith
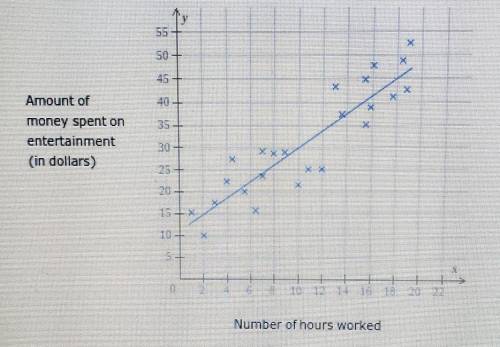
The scatter plot below shows the number of hours worked, x, and the amount of money spent on entertainment, y, by each of 24 students.
Use the equation of the line of best fit, y=1.88x + 11.24, to answer the questions below.
Give exact answers, not rounded approximations.
a). What is the predicated amount of money spent on entertainment for a student who works 10 hours?
b). What is the predicted amount of money spent on entertainment for a student who doesn't work any hours?
c.) For an increase of one hour in time worked, what is the predicted increase in the amount of money spent on entertainment?

Answers: 3


Other questions on the subject: Mathematics
Mathematics, 21.06.2019 17:00, KendallTishie724
In the given figure ar(adf) =ar(cda) and ar(cdf) = ar(cdf). show that abdc and cdfe are trapeziums.
Answers: 2
Mathematics, 21.06.2019 18:30, angelapegues20097
Tyler enjoys the fish so much that after his birthday his family decides to take him to a famous aquarium a tank at the aquarium is similar to his tank with the scale factor of 8 how many times greater is the volume of the tank at the aquarium than the volume of tyler tank
Answers: 2
Mathematics, 21.06.2019 19:00, chloebaby8
Find the equation of a line whose slope is 2/5 and y- intercept is 2.write your answer in the form 1) ax+by+c=02) x/a+y/b=1
Answers: 1
You know the right answer?
The scatter plot below shows the number of hours worked, x, and the amount of money spent on enterta...
Questions in other subjects:


Mathematics, 13.11.2020 22:30

Chemistry, 13.11.2020 22:30

Geography, 13.11.2020 22:30
Mathematics, 13.11.2020 22:30
Mathematics, 13.11.2020 22:30

History, 13.11.2020 22:30


