
Mathematics, 21.02.2021 20:20 Thatweirdgirly5
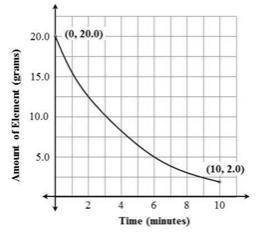
The graph models the amount of radioactive element present over the course of a 10-minute experiment.
What is the average rate of change of the amount of the element over the 10-minute experiment?
A. -2.0 g/min
B. -1.8 g/min
C. -0.2 g/min
D. -5.0 g/min

Answers: 3


Other questions on the subject: Mathematics
Mathematics, 21.06.2019 23:40, jahnoibenjamin
Select the correct answer what is the 10th term of the geometric sequence 3,6, 12, 24,48 a. 512 b. 3,072 c. 768 d. 1,536
Answers: 2
Mathematics, 22.06.2019 01:10, sman091305
Ofin . (2,4) (2,1) a. y= 2 b. x= 2 c. x= -2 d. y= 2x
Answers: 1
You know the right answer?
The graph models the amount of radioactive element present over the course of a 10-minute experiment...
Questions in other subjects:

Mathematics, 13.04.2021 20:50

History, 13.04.2021 20:50
Mathematics, 13.04.2021 20:50
Mathematics, 13.04.2021 20:50


