
Mathematics, 21.02.2021 01:00 rosie20052019
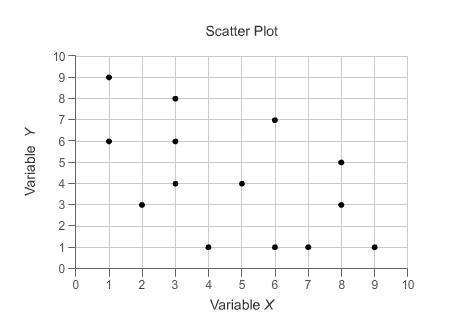
(06.02)Jordan plotted the graph below to show the relationship between the temperature of his city and the number of cups of hot chocolate he sold daily:
A scatter plot is shown with the title Jordans Hot Chocolate Sales. The x axis is labeled High Temperature and the y axis is labeled Cups of Hot Chocolate Sold. Data points are located at 20 and 20, 30 and 18, 40 and 20, 35 and 15, 50 and 20, 45 and 20, 60 and 14, 65 and 18, 80 and 10, 70 and 8, 40 and 2.
Part A: In your own words, describe the relationship between the temperature of the city and the number of cups of hot chocolate sold. (2 points)
Part B: Describe how you can make the line of best fit. Write the approximate slope and y-intercept of the line of best fit. Show your work, including the points that you use to calculate the slope and y-intercept. (3 points)

Answers: 3


Other questions on the subject: Mathematics
Mathematics, 21.06.2019 14:50, bustillojoshua4
On a piece of paper, graph . then determine which answer choice matches the graph you drew
Answers: 1
Mathematics, 22.06.2019 01:30, genyjoannerubiera
Andy has $310 in his account. each week, w, he withdraws $30 for his expenses. which expression could be used if he wanted to find out how much money he had left after 8 weeks?
Answers: 1
Mathematics, 22.06.2019 02:20, hannahgrac3
Of the 27 players trying out for the school basketball team, 8 are more than 6 feet tall and 7 have good aim. what is the probability that the coach would randomly pick a player over 6 feet tall or a player with a good aim? assume that no players over 6 feet tall have good aim. a. b. c. d.
Answers: 1
Mathematics, 22.06.2019 02:30, gracie0818
Last month, leonhard euler's watch kiosk at the mall had total sales of $9,489. merchandise totaling $225 was returned. the goods that were sold cost leonhard euler's $5,481. operating expenses for the moth were $992. what was the gross profit on sales?
Answers: 1
You know the right answer?
(06.02)Jordan plotted the graph below to show the relationship between the temperature of his city a...
Questions in other subjects:


Social Studies, 07.05.2021 22:00
Mathematics, 07.05.2021 22:00


