Mathematics, 19.02.2021 18:00 itsdeevv
‼️‼️Pls Help this is due soon (25 points)‼️‼️
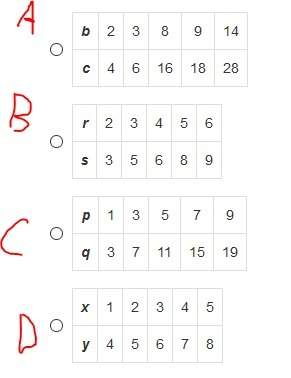
Draw a diagram to represent the situation:
The number of miles driven this month was a 30% decrease of the number of miles driven last month

Answers: 2


Other questions on the subject: Mathematics


Mathematics, 21.06.2019 23:50, mommies3grls3
Which function has the domain x> -11? y= x+ 11 +5 y= x-11 +5 y= x+5 - 11 y= x+5 + 11
Answers: 2

Mathematics, 22.06.2019 00:00, jair512872
What is the value of x in this triangle? a. 53° b. 62° c. 65° d. 118°
Answers: 2

Mathematics, 22.06.2019 02:30, QueenNerdy889
Which statement best explains whether the table represents a linear or nonlinear function? input (x) output (y) 2 5 4 10 6 15 8 20 it is a linear function because the input values are increasing. it is a nonlinear function because the output values are increasing. it is a linear function because there is a constant rate of change in both the input and output. it is a nonlinear function because there is a constant rate of change in both the input and output.
Answers: 3
You know the right answer?
‼️‼️Pls Help this is due soon (25 points)‼️‼️
Draw a diagram to represent the situation:
Questions in other subjects:


History, 18.06.2021 06:50

Mathematics, 18.06.2021 06:50


Spanish, 18.06.2021 06:50


