
Mathematics, 19.02.2021 17:40 shaniahharrisoov3lqv
(YOU CAN LOOK AT IMAGE OR LOOK AT INFORMATION BELOW)
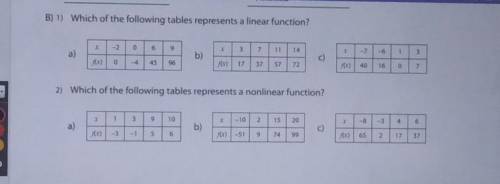
Which of the Following tables represents a linear function?
A) X. -2. 0. 6. 9
f(x) 0. -4. 45. 96
B) X. 3. 7. 11. 14
f(x) 17. 37. 57. 72
C) X. -7. -6. 1. 3
f(x) 40. 16. 0. 7
Which of the following tables represent a nonlinear function?
A) X. 1. 3. 9. 10
f(x) -3. -1. 5. 6
B) X. -10 2 15 20
f(x) -51 9 74 99
C) X. -8 -3. 4. 6
f(x) 65. 2. 17. 37

Answers: 2


Other questions on the subject: Mathematics
Mathematics, 21.06.2019 16:30, jordivivar74
For how answer my question this will be the last question can you answer in math subject
Answers: 2
Mathematics, 21.06.2019 17:00, thicklooney
Which expression is equivalent to 8(k + m) − 15(2k + 5m)?
Answers: 1
Mathematics, 21.06.2019 21:30, alexialoredo625
Plz hurry evaluate the expression a+b where a=8 and b=19
Answers: 1
Mathematics, 21.06.2019 23:00, Izzyfizzy1
The value of cos 30° is the same as which of the following?
Answers: 1
You know the right answer?
(YOU CAN LOOK AT IMAGE OR LOOK AT INFORMATION BELOW)
Which of the Following tables represents a lin...
Questions in other subjects:

Mathematics, 03.02.2021 04:10
Business, 03.02.2021 04:10


History, 03.02.2021 04:10

Computers and Technology, 03.02.2021 04:10
Mathematics, 03.02.2021 04:10

Physics, 03.02.2021 04:10


