11-
10
9
OP
7
6
Weight (kilograms)
01
NO
X
1<...

Mathematics, 19.02.2021 14:00 adriana145
11-
10
9
OP
7
6
Weight (kilograms)
01
NO
X
1
2
3
8
9
10
4 5 6 7
Age (months)
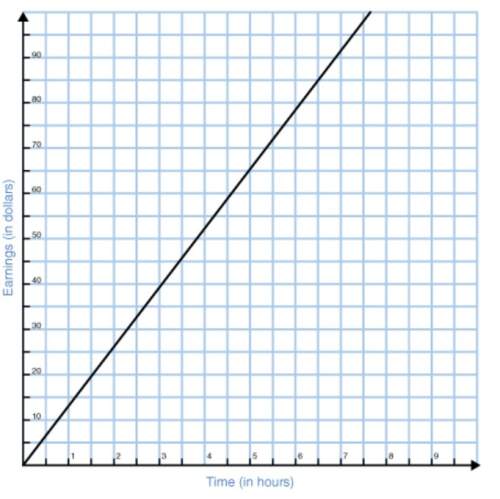
The scatter plot shows the weight of a child each month.
per month.
kilograms. The child gains an average of
The birth weight of the child is
Reset
Next

Answers: 2


Other questions on the subject: Mathematics
Mathematics, 21.06.2019 22:50, kristofwr3444
Use the quadratic function to predict f(x) if x equals 8. f(x) = 25x2 − 28x + 585
Answers: 1
Mathematics, 22.06.2019 00:30, andy963936
The measures of two supplementary angles are (2x + 10)° and (8x + 10)°. what is the measure of the larger angle? a. 16° b. 44° c. 14° d. 138°
Answers: 2
Mathematics, 22.06.2019 01:00, AvaHeff
The stem-and-leaf plot shows the heights in centimeters of teddy bear sunflowers grown in two different types of soil. soil a soil b 5 9 5 2 1 1 6 3 9 5 1 0 7 0 2 3 6 7 8 2 1 8 3 0 9 key: 9|6 means 69 key: 5|8 means 58 calculate the mean of each data set. calculate the mean absolute deviation (mad) of each data set. which set is more variable? how do you know?
Answers: 2
Mathematics, 22.06.2019 01:00, nyraimccall408
Which is an accurate comparison of the two data sets? the commute to work is typically shorter and more consistent than the commute home. the commute to work is typically shorter but less consistent than the commute home. the commute to work is typically longer and less consistent than the commute home. the commute to work is typically longer but more consistent than the commute home.
Answers: 2
You know the right answer?
Questions in other subjects:


Mathematics, 20.04.2020 21:34

Computers and Technology, 20.04.2020 21:34

Biology, 20.04.2020 21:34

Mathematics, 20.04.2020 21:34


