
Mathematics, 18.02.2021 19:10 lolsmaster3951
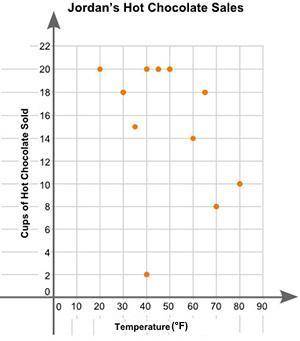
Will give brainliest to the correct answer Jordan plotted the graph below to show the relationship between the temperature of his city and the number of cups of hot chocolate he sold daily: A scatter plot is shown with the title Jordans Hot Chocolate Sales. The x axis is labeled High Temperature and the y axis is labeled Cups of Hot Chocolate Sold. Data points are located at 20 and 20, 30 and 18, 40 and 20, 35 and 15, 50 and 20, 45 and 20, 60 and 14, 65 and 18, 80 and 10, 70 and 8, 40 and 2. Part A: In your own words, describe the relationship between the temperature of the city and the number of cups of hot chocolate sold. (2 points) Part B: Describe how you can make the line of best fit. Write the approximate slope and y-intercept of the line of best fit. Show your work, including the points that you use to calculate the slope and y-intercept. (3 points)

Answers: 2


Other questions on the subject: Mathematics
Mathematics, 21.06.2019 15:10, Mistytrotter
Solve the system by the elimination method. x + y - 6 = 0 x - y - 8 = 0 when you eliminate y , what is the resulting equation? 2x = -14 2x = 14 -2x = 14
Answers: 2
Mathematics, 21.06.2019 18:10, ltuthill
Jordan has $5.37, which he is using to buy ingredients to make salsa. he is buying one red pepper for $1.29 and three pounds of tomatoes. if jordan has exactly the right amount of money he needs, what is the price per pound of the tomatoes? choose the correct equation to represent this real-world problem. solve the equation and verify the reasonableness of your answer. a pound of tomatoes costs .
Answers: 1
Mathematics, 21.06.2019 22:30, thelonewolf5020
Amachine that produces a special type of transistor (a component of computers) has a 2% defective rate. the production is considered a random process where each transistor is independent of the others. (a) what is the probability that the 10th transistor produced is the first with a defect? (b) what is the probability that the machine produces no defective transistors in a batch of 100? (c) on average, how many transistors would you expect to be produced before the first with a defect? what is the standard deviation? (d) another machine that also produces transistors has a 5% defective rate where each transistor is produced independent of the others. on average how many transistors would you expect to be produced with this machine before the first with a defect? what is the standard deviation? (e) based on your answers to parts (c) and (d), how does increasing the probability of an event a↵ect the mean and standard deviation of the wait time until success?
Answers: 3
You know the right answer?
Will give brainliest to the correct answer
Jordan plotted the graph below to show the relationship...
Questions in other subjects:

English, 20.09.2020 02:01
Mathematics, 20.09.2020 02:01
Mathematics, 20.09.2020 02:01

Mathematics, 20.09.2020 02:01
Mathematics, 20.09.2020 02:01

Arts, 20.09.2020 02:01
Mathematics, 20.09.2020 02:01


