
Mathematics, 18.02.2021 16:20 hiitslillyhere
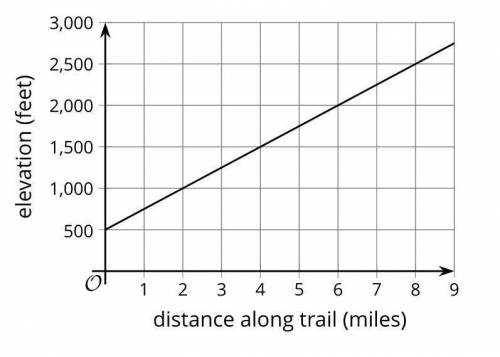
A group of hikers is progressing steadily along an uphill trail. The graph shows their elevation (or height above sea level), in feet, at each distance from the start of the trail, in miles.
What is the slope of the graph? Show your reasoning.
What does the slope tell us about this situation?
Write an equation that represents the relationship between the hikers' distance from the start of the trail, x, and their elevation, y.
Does the equation y-250x=500 represent the same relationship between the distance from the start of trail and the elevation? Explain your reasoning.

Answers: 1


Other questions on the subject: Mathematics
Mathematics, 21.06.2019 20:50, brea2006
An automobile assembly line operation has a scheduled mean completion time, μ, of 12 minutes. the standard deviation of completion times is 1.6 minutes. it is claimed that, under new management, the mean completion time has decreased. to test this claim, a random sample of 33 completion times under new management was taken. the sample had a mean of 11.2 minutes. assume that the population is normally distributed. can we support, at the 0.05 level of significance, the claim that the mean completion time has decreased under new management? assume that the standard deviation of completion times has not changed.
Answers: 3
Mathematics, 21.06.2019 21:50, elsauceomotho
Which value of y will make the inequality y< -1 false?
Answers: 2
You know the right answer?
A group of hikers is progressing steadily along an uphill trail. The graph shows their elevation (or...
Questions in other subjects:

Mathematics, 03.08.2020 14:01

Chemistry, 03.08.2020 14:01

History, 03.08.2020 14:01
Mathematics, 03.08.2020 14:01
Mathematics, 03.08.2020 14:01

Social Studies, 03.08.2020 14:01


