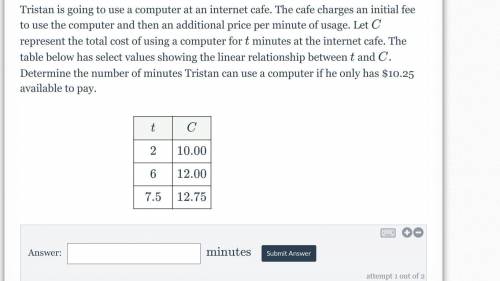
How many minutes please help me.
...

Mathematics, 18.02.2021 02:10 tajonae04
How many minutes please help me.

Answers: 3


Other questions on the subject: Mathematics
Mathematics, 21.06.2019 19:10, Lewis5442
Do more republicans (group a) than democrats (group b) favor a bill to make it easier for someone to own a firearm? two hundred republicans and two hundred democrats were asked if they favored a bill that made it easier for someone to own a firearm. how would we write the alternative hypothesis?
Answers: 1
Mathematics, 22.06.2019 01:40, ashleygarcia0884
At wind speeds above 1000 centimeters per second (cm/sec), significant sand-moving events begin to occur. wind speeds below 1000 cm/sec deposit sand and wind speeds above 1000 cm/sec move sand to new locations. the cyclic nature of wind and moving sand determines the shape and location of large dunes. at a test site, the prevailing direction of the wind did not change noticeably. however, the velocity did change. fifty-nine wind speed readings gave an average velocity of x = 1075 cm/sec. based on long-term experience, σ can be assumed to be 245 cm/sec. (a) find a 95% confidence interval for the population mean wind speed at this site. (round your answers to the nearest whole number.) lower limit cm/sec upper limit cm/sec
Answers: 2
Mathematics, 22.06.2019 03:00, dominiqueallen23
Describe how the presence of possible outliers might be identified on the following. (a) histograms gap between the first bar and the rest of bars or between the last bar and the rest of bars large group of bars to the left or right of a gap higher center bar than surrounding bars gap around the center of the histogram higher far left or right bar than surrounding bars (b) dotplots large gap around the center of the data large gap between data on the far left side or the far right side and the rest of the data large groups of data to the left or right of a gap large group of data in the center of the dotplot large group of data on the left or right of the dotplot (c) stem-and-leaf displays several empty stems in the center of the stem-and-leaf display large group of data in stems on one of the far sides of the stem-and-leaf display large group of data near a gap several empty stems after stem including the lowest values or before stem including the highest values large group of data in the center stems (d) box-and-whisker plots data within the fences placed at q1 â’ 1.5(iqr) and at q3 + 1.5(iqr) data beyond the fences placed at q1 â’ 2(iqr) and at q3 + 2(iqr) data within the fences placed at q1 â’ 2(iqr) and at q3 + 2(iqr) data beyond the fences placed at q1 â’ 1.5(iqr) and at q3 + 1.5(iqr) data beyond the fences placed at q1 â’ 1(iqr) and at q3 + 1(iqr)
Answers: 1
Mathematics, 22.06.2019 04:10, carleygalloway103
Acoin is tossed 4 times which of the following represents the probability of the coin landing on heads all 4 times
Answers: 1
You know the right answer?
Questions in other subjects:

Mathematics, 05.09.2021 14:00

Social Studies, 05.09.2021 14:00


Biology, 05.09.2021 14:00


