
Mathematics, 18.02.2021 01:00 texas101st78
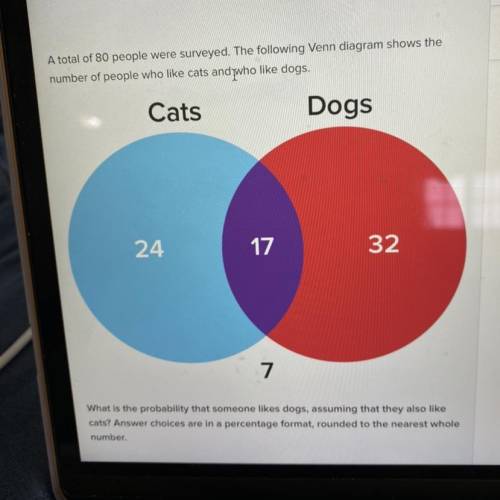
A total of 80 people were surveyed. The following Venn diagram shows the
number of people who like cats and who like dogs.
Cats 24
Dogs 32
Both 17
24
17
32
7
What is the probability that someone likes dogs, assuming that they also like
cats? Answer choices are in a percentage format, rounded to the nearest whole
number.

Answers: 2


Other questions on the subject: Mathematics
Mathematics, 21.06.2019 19:00, bellbradshaw16
Suppose that one doll house uses the 1 inch scale, meaning that 1 inch on the doll house corresponds to 1/2 foot for life-sized objects. if the doll house is 108 inches wide, what is the width of the full-sized house that it's modeled after? in inches and feet.
Answers: 2
Mathematics, 22.06.2019 02:30, oscaralan01
Solve the system of equations. 2x-2y=-4 and x+y=8. show work
Answers: 1
Mathematics, 22.06.2019 03:00, molinaemily009
At the beginning of the year, adrian's savings account balance was \$28$28. each week, he deposits another \$15$15 into that account, and he doesn't spend any of his savings. is his savings account balance proportional to the number of weeks since the start of the year?
Answers: 1
You know the right answer?
A total of 80 people were surveyed. The following Venn diagram shows the
number of people who like...
Questions in other subjects:
Mathematics, 17.09.2020 01:01
Mathematics, 17.09.2020 01:01
Mathematics, 17.09.2020 02:01

Social Studies, 17.09.2020 02:01
Mathematics, 17.09.2020 02:01
Mathematics, 17.09.2020 02:01
Mathematics, 17.09.2020 02:01
Mathematics, 17.09.2020 02:01
Mathematics, 17.09.2020 02:01
Mathematics, 17.09.2020 02:01


