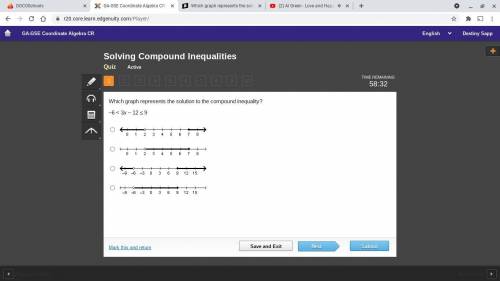
Which graph represents the solution to the compound inequality?
–6 < 3x – 12 ≤ 9
A n...

Mathematics, 17.02.2021 22:00 alexander1093
Which graph represents the solution to the compound inequality?
–6 < 3x – 12 ≤ 9
A number line with an open circle at 2 with a bold line pointing to the left. A point at 7 with a bold line pointing to the right.
A number line with an open circle at 2 with a bold line pointing to the right ending at the point at 7.
A number line with an open circle at negative 6 with a bold line pointing to the left. A point at 9 with a bold line pointing to the right.
A number line with an open circle at negative 6 with a bold line pointing to the right ending at the point at 9.

Answers: 1


Other questions on the subject: Mathematics
Mathematics, 21.06.2019 14:50, westlakebuddy1229
If f(x) = 2x + 2 and g(x) = x? , what is (gºf)(2)?
Answers: 2
Mathematics, 21.06.2019 22:00, costel8532
Which of the following graphs could represent a cubic function?
Answers: 1
Mathematics, 22.06.2019 03:00, mariam00000w
In the triangle rst, rs = 65 and st = 60. which equation could be used to find the value of angle s?
Answers: 2
You know the right answer?
Questions in other subjects:
Mathematics, 03.02.2020 02:56

Mathematics, 03.02.2020 02:56

French, 03.02.2020 02:56
Mathematics, 03.02.2020 02:56

Mathematics, 03.02.2020 02:56


