
Mathematics, 17.02.2021 08:00 jobrains3220
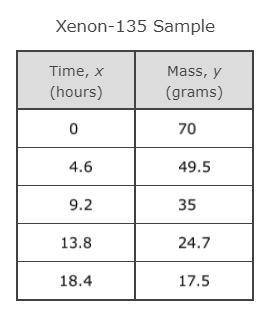
The table represents some points on the graph of the exponential function that models the radioactive decay of a sample of xenon-135.
Which statement about the graph of this function is true?
(See the picture below)
A) There is an asymptote at y = 70.
B) The y-intercept is located at (0, 70).
C) There is an asymptote at x = 0.
D) The x-intercept is located at (70, 0).

Answers: 3


Other questions on the subject: Mathematics
Mathematics, 21.06.2019 19:00, Islandgirl67
What are the solutions of the system? solve by graphing. y = x^2 + 3x + 2 y = 2x + 2
Answers: 1
Mathematics, 21.06.2019 22:00, mairadua14
To decrease an amount by 16% what single multiplier would you use
Answers: 1
Mathematics, 21.06.2019 22:30, natalievick03
At the beginning of year 1, carlos invests $600 at an annual compound interest rate of 4%. he makes no deposits to or withdrawals from the account. which explicit formula can be used to find the account's balance at the beginning of year 5? what is, the balance?
Answers: 2
You know the right answer?
The table represents some points on the graph of the exponential function that models the radioactiv...
Questions in other subjects:
Mathematics, 08.07.2019 10:00


English, 08.07.2019 10:00
Mathematics, 08.07.2019 10:00

Biology, 08.07.2019 10:00


History, 08.07.2019 10:00


Health, 08.07.2019 10:00


