
Mathematics, 17.02.2021 05:10 tiffanybrandy23
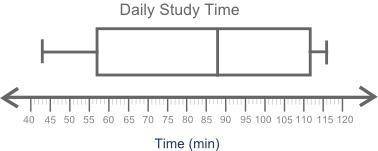
(08.05)The box plot shows the total amount of time, in minutes, the students of a class spend studying each day:
A box plot is titled Daily Study Time and labeled Time (min). The left most point on the number line is 40 and the right most point is 120. The box is labeled 57 on the left edge and 112 on the right edge. A vertical line is drawn inside the rectangle at the point 88. The whiskers are labeled as 43 and 116.
Brainliest + thanks and 5 stars!
What information is provided by the box plot?
The lower quartile for the data
The number of students who provided information
The mean for the data
The number of students who studied for more than 112.5 minutes

Answers: 3


Other questions on the subject: Mathematics
Mathematics, 21.06.2019 17:00, Zykuko
Asays "we are both knaves" and b says nothing. exercises 24–31 relate to inhabitants of an island on which there are three kinds of people: knights who always tell the truth, knaves who always lie, and spies (called normals by smullyan [sm78]) who can either lie or tell the truth. you encounter three people, a, b, and c. you know one of these people is a knight, one is a knave, and one is a spy. each of the three people knows the type of person each of other two is. for each of these situations, if possible, determine whether there is a unique solution and determine who the knave, knight, and spy are. when there is no unique solution, list all possible solutions or state that there are no solutions. 24. a says "c is the knave," b says, "a is the knight," and c says "i am the spy."
Answers: 2
Mathematics, 21.06.2019 20:50, kassandramarie16
Amanda went into the grocery business starting with five stores. after one year, she opened two more stores. after two years, she opened two more stores than the previous year. if amanda expands her grocery business following the same pattern, which of the following graphs represents the number of stores she will own over time?
Answers: 3
Mathematics, 21.06.2019 22:00, nyceastcoast
Percent increase and decrease. original number: 45 new number: 18
Answers: 1
You know the right answer?
(08.05)The box plot shows the total amount of time, in minutes, the students of a class spend studyi...
Questions in other subjects:
Mathematics, 02.10.2020 16:01
Mathematics, 02.10.2020 16:01

Biology, 02.10.2020 16:01
Mathematics, 02.10.2020 16:01


English, 02.10.2020 16:01


