Mathematics, 17.02.2021 01:20 emmavaran03
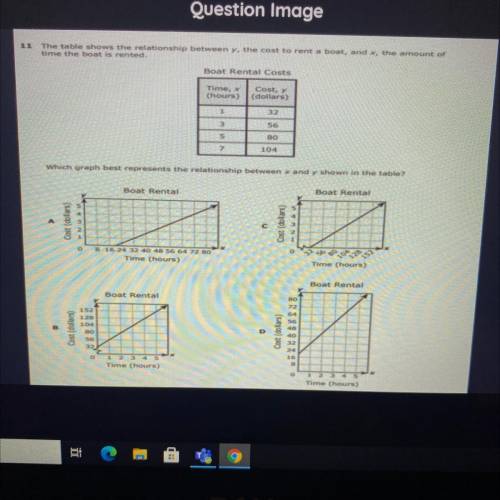
The table shows the relationship between y, the cost to rent a boat, and x, the amount of times the boat is rented. Which graph best represents the relay between x and y shown in the table?


Answers: 3


Other questions on the subject: Mathematics


Mathematics, 21.06.2019 22:10, BilliePaul95
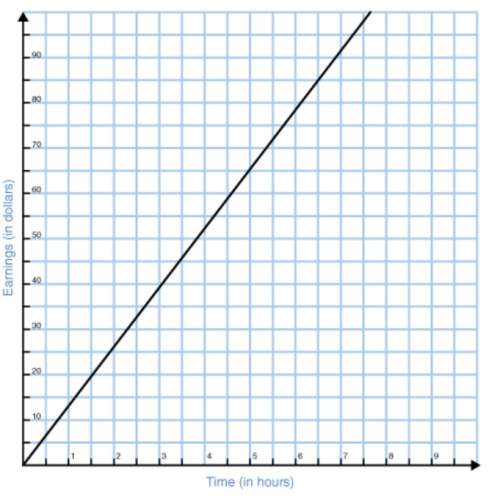
Ellen makes and sells bookmarks. she graphs the number of bookmarks sold compared to the total money earned. why is the rate of change for the function graphed to the left?
Answers: 1

Mathematics, 21.06.2019 23:50, obrunelle4678
Solve for x in the equation x2 - 12x + 36 = 90. x= 6+3x/10 x=6+2/7 x= 12+3/22 x = 12+3/10
Answers: 2
You know the right answer?
The table shows the relationship between y, the cost to rent a boat, and x, the amount of times the...
Questions in other subjects:


Mathematics, 13.05.2020 22:57


Mathematics, 13.05.2020 22:57

Biology, 13.05.2020 22:57


