
Mathematics, 16.02.2021 22:40 nosleepbrooklyn2006
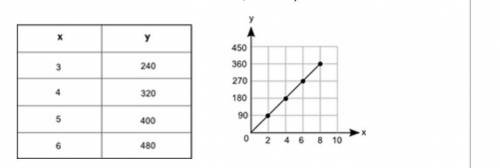
The table and the graph each show a different relationship between the same two variables, x and y:
A table with two columns and 5 rows is shown. The column head for the left column is x, and the column head for the right column is y. The row entries in the table are 3,240 and 4,320 and 5,400 and 6,480. On the right of this table is a graph. The x axis values are from 0 to 10 in increments of 2 for each grid line. The y axis values on the graph are from 0 to 450 in increments of 90 for each grid line. A line passing through the ordered pairs 2, 90 and 4, 180 and 6, 270 and 8, 360 is drawn.
How much more would the value of y be in the table than its value on the graph when x = 17?

Answers: 2


Other questions on the subject: Mathematics
Mathematics, 21.06.2019 12:30, edna27
(note i put the graph in so plz )the graph shows the amount of water that remains in a barrel after it begins to leak. the variable x represents the number of days that have passed since the barrel was filled, and y represents the number of gallons of water that remain in the barrel. what is the slope of the line
Answers: 1
Mathematics, 21.06.2019 15:00, jfarley259
Hye ryung is the president of the local chapter of the american medical students association (amsa). she is organizing local outreach and informational meetings. at her first meeting there are five people present (including herself). every month after that her group grows by 5 people. a. how many members are in the group after 6 months? b. the logistics of hosting and feeding her group at meetings was more complicated than expected. the cost of feeding 5 people at her first meeting was $30, for 10 people it was $35, for 15 it was $45, and after 6 months all of the costs had added up to $100. write a function to model the cost with the number of people attending meetings. c. what connections can you make between the linear growth of the group’s membership and the increasing costs of running meetings?
Answers: 3
Mathematics, 21.06.2019 19:30, joselinegarciaowyrpf
Asquare picture with sides of 32 inches is to be mounted on a square mat with sides of 52 inches. find the area of the mat that will remain uncovered by the picture.
Answers: 1
Mathematics, 21.06.2019 23:40, breannaasmith1122
Me d is also an option but i couldn't get it in the picture
Answers: 2
You know the right answer?
The table and the graph each show a different relationship between the same two variables, x and y:...
Questions in other subjects:
Mathematics, 18.10.2020 01:01

History, 18.10.2020 01:01

Social Studies, 18.10.2020 01:01
Mathematics, 18.10.2020 01:01

Mathematics, 18.10.2020 01:01


