
Mathematics, 16.02.2021 18:00 idontknow11223344
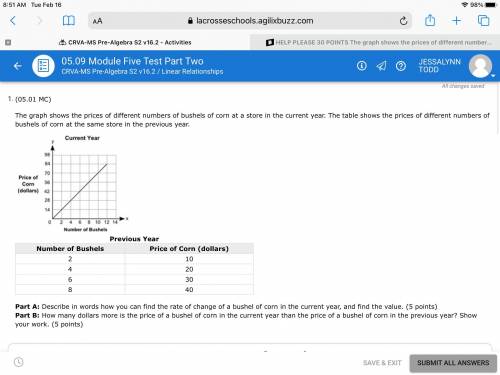
The graph shows the prices of different numbers of bushels of corn at a store in the current year. The table shows the prices of different numbers of bushels of corn at the same store in the previous year.
Part A: Describe in words how you can find the rate of change of a bushel of corn in the current year, and find the value. (5 points)
Part B: How many dollars more is the price of a bushel of corn in the current year than the price of a bushel of corn in the previous year? Show your work.

Answers: 2


Other questions on the subject: Mathematics
Mathematics, 21.06.2019 19:00, morgeron6071
Which statement best explains why ben uses the width hi to create the arc at j from point k
Answers: 2
Mathematics, 21.06.2019 19:00, mcccreamullinsr
How can you tell when x and y are not directly proportional?
Answers: 1
Mathematics, 21.06.2019 21:30, madisonsimmons1120
Mon wants to make 5 lbs of the sugar syrup. how much water and how much sugar does he need… …to make 5% syrup?
Answers: 2
You know the right answer?
The graph shows the prices of different numbers of bushels of corn at a store in the current year. T...
Questions in other subjects:


Mathematics, 25.02.2020 04:24
Mathematics, 25.02.2020 04:24


