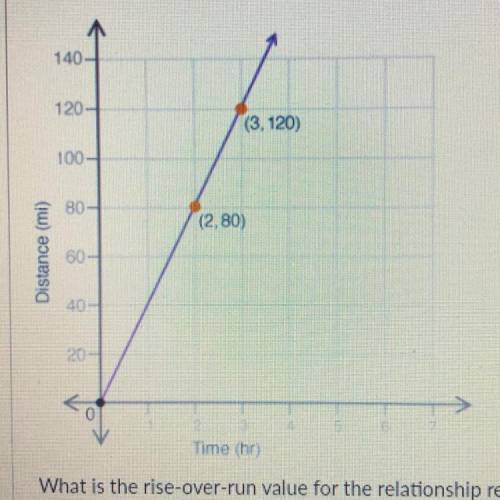
The graph shows the distance a car traveled, y, in x hours:
140
120-
(3.120)
100-...

Mathematics, 16.02.2021 16:50 stephanieanaya7
The graph shows the distance a car traveled, y, in x hours:
140
120-
(3.120)
100-
80-
(2.80)
Distance (mi)
60-
40-
20
Time thr)
What is the rise-over-run value for the relationship represented in the graph? (4 points)
40
80
o
1
40
80

Answers: 3


Other questions on the subject: Mathematics
Mathematics, 21.06.2019 18:00, evanwall91
Need on this geometry question. explain how you did it.
Answers: 2
Mathematics, 21.06.2019 23:00, slonekaitlyn01
Shared decision making is always a positive strategy to take
Answers: 1
You know the right answer?
Questions in other subjects:

Biology, 20.10.2020 01:01
Mathematics, 20.10.2020 01:01


History, 20.10.2020 01:01


