
Mathematics, 16.02.2021 02:40 Machuco127
I need help with questions A&B please answer!!
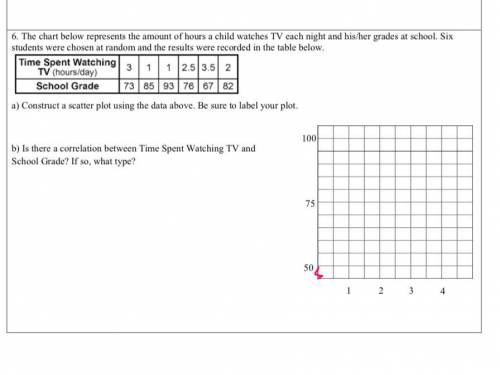
The chart below represents the amount of hours a child watches TV each night and his/her grades at school. Six students were chosen at random and the results were recorded in the table below.
a) Construct a scatter plot using the data above. Be sure to label your plot.
b) Is there a correlation between Time Spent Watching TV and School Grade? If so, what type?

Answers: 1


Other questions on the subject: Mathematics
Mathematics, 20.06.2019 18:04, kaveon2019
Ineed with this math problem p(65)=500×1.0325*65 the star means that you have to times it like 1.0325×1.0325?
Answers: 2
Mathematics, 21.06.2019 22:30, muziqbox594
What is the name of a polygon that has four congruent sides and theses angle measures 60,120,60,120?
Answers: 1
Mathematics, 21.06.2019 22:30, cbkhm
Tommy buys a sweater that is on sale for 40% off the original price. the expression p -0.4p can be used to find the sale price of the sweater, where p is the original price of the sweater. if the original price of the sweater is 50, what is the sale price?
Answers: 1
Mathematics, 22.06.2019 01:30, codyczajka
The host of a game show is holding a bag with chips to see what prizes the contestants will play for. five (5) of the chips say “new car” ten (10) of the chips say “new tv” three (3) of the chips say “trip to france” contestant named “patty” reaches into the bag. a. what is the probability of choosing a tv chip? b. what is the probability of choosing a car chip next without replacing the 1st chip? c. are these dependent or independent events?
Answers: 1
You know the right answer?
I need help with questions A&B please answer!!
The chart below represents the amount of hours a...
Questions in other subjects:


History, 08.05.2020 18:57

Mathematics, 08.05.2020 18:57
Physics, 08.05.2020 18:57


