
Mathematics, 16.02.2021 01:20 joejoefofana
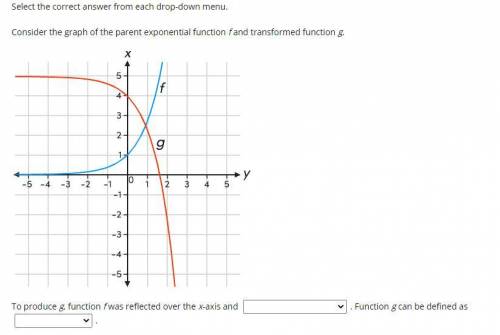
Consider the graph of the parent exponential function f and transformed function g.
To produce g, function f was reflected over the x-axis and
shifted to the left 1 unit
shifted to the right 1 unit
shifted up 3 units
shifted up 5 units
Function g can be defined as
g(x)=-f(x)+5
g(x)=f(x+1)-4
g(x)=-f(x+5)
g(x)=f(x-1)+4

Answers: 3


Other questions on the subject: Mathematics
Mathematics, 21.06.2019 15:00, greekfreekisdbz
Use the graph to determine the range. which notations accurately represent the range? check all that apply. (–∞, 2) u (2, ∞) (–∞, –2) u (–2, ∞) {y|y ∈ r, y ≠ –2} {y|y ∈ r, y ≠ 2} y < 2 or y > 2 y < –2 or y > –2
Answers: 1
Mathematics, 21.06.2019 19:00, kayranicole1
The weekly revenue for a company is r = 3p^2 + 60p + 1060, where p is the price of the company's product. what price will result in a revenue of $1200.
Answers: 1
Mathematics, 21.06.2019 22:50, sarbjit879
Which linear inequality is represented by the graph?
Answers: 1
You know the right answer?
Consider the graph of the parent exponential function f and transformed function g.
To produce g, f...
Questions in other subjects:
Mathematics, 27.08.2019 18:00

History, 27.08.2019 18:00
History, 27.08.2019 18:00


Mathematics, 27.08.2019 18:00

English, 27.08.2019 18:00


