
Mathematics, 15.02.2021 23:10 lilfofo9
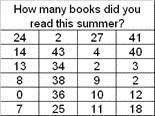
Below are the results from a survey about how many books were read this summer.
To graph the information into a frequency table, which interval below would be the most appropriate?
A. 2
B. 4
C. 10
D. 20

Answers: 3


Other questions on the subject: Mathematics
Mathematics, 21.06.2019 17:40, skylerdemi1
A. 127 cm^2 b. 144.5 cm^2 c. 172 cm^2 d. 50 cm^2
Answers: 2
Mathematics, 22.06.2019 02:00, amberskids2
Consider the linear function that is represented by the equation y= 4x+5
Answers: 1
You know the right answer?
Below are the results from a survey about how many books were read this summer.
To graph the inform...
Questions in other subjects:

History, 12.11.2020 01:00

Physics, 12.11.2020 01:00

Mathematics, 12.11.2020 01:00
Mathematics, 12.11.2020 01:00


