
Mathematics, 13.02.2021 21:30 Katepratt7637
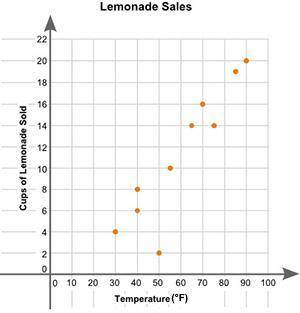
)Eric plotted the graph below to show the relationship between the temperature of his city and the number of cups of lemonade he sold daily
Part A: Describe the relationship between the temperature of the city and the number of cups of lemonade sold. (2 points)
Part B: Describe how you can make the line of best fit. Write the approximate slope and y-intercept of the line of best fit. Show your work, including the points that you use to calculate the slope and y-intercept. (3 points)

Answers: 2


Other questions on the subject: Mathematics
Mathematics, 21.06.2019 13:00, drakesmith43
The production line where you work can assemble 5 appliers every 30 minutes at this rate how long should it take the line to assemble 125 amplifiers
Answers: 1
Mathematics, 21.06.2019 13:00, mahkitheking16
Find the value of a. the diagram is not to scale. a quadrilateral is drawn. the upper and lower sides are parallel. the interior angle in the upper left corner is labeled a degrees. the angle in the upper right corner is labeled 113 degrees. the angle in the lower right corner is labeled b degrees. the angle in the lower left corner is labeled 36 degrees. a. 36 b. 144 c. 54 d. 126
Answers: 1
Mathematics, 21.06.2019 19:00, breannaasmith1122
Which of the expressions (on the photo document i inserted) together represent all solutions to the following equation? 8cos(12x)+4=-4 *the answer should be in degrees.* > i would like for someone to explain the process to find the solutions for this.
Answers: 2
Mathematics, 21.06.2019 22:00, leomcintyre12
If you have 12 feet of string and you cut it into equal length of 5 inches each how much string will be left
Answers: 2
You know the right answer?
)Eric plotted the graph below to show the relationship between the temperature of his city and the n...
Questions in other subjects:


Biology, 11.03.2020 00:18


Health, 11.03.2020 00:18


