
Mathematics, 13.02.2021 01:00 rosie20052019
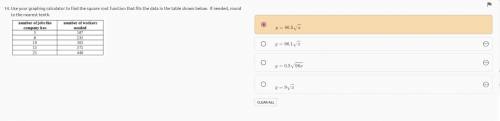
Use your graphing calculator to find the square root function that fits the data in the table shown below. If needed, round to the nearest tenth.

Answers: 2


Other questions on the subject: Mathematics
Mathematics, 22.06.2019 00:30, hannahpalacios101
36x2 + 49y2 = 1,764 the foci are located at: a) (-√13, 0) and (√13,0) b) (0, -√13) and (0,√13) c) (-1, 0) and (1, 0)
Answers: 1
Mathematics, 22.06.2019 02:00, fespinoza019
The null and alternate hypotheses are: h0: μ1 ≤ μ2 h1: μ1 > μ2 a random sample of 22 items from the first population showed a mean of 113 and a standard deviation of 12. a sample of 16 items for the second population showed a mean of 99 and a standard deviation of 6. use the 0.01 significant level. find the degrees of freedom for unequal variance test. (round down your answer to the nearest whole number.) state the decision rule for 0.010 significance level. (round your answer to 3 decimal places.) compute the value of the test statistic. (round your answer to 3 decimal places.) what is your decision regarding the null hypothesis? use the 0.01 significance level.
Answers: 1
Mathematics, 22.06.2019 04:20, blueval3tine
The width of a piece of rectangular land is 5m shorter rhan 1/3 of its length .find the width of the land if the length is 60m,150m.
Answers: 2
Mathematics, 22.06.2019 06:00, jennifermsalzo
Evaluate f(x) when x= -9. f(x)= 16x® + 2 6 12 if 9 < x < 13 no solution 488 12
Answers: 1
You know the right answer?
Use your graphing calculator to find the square root function that fits the data in the table shown...
Questions in other subjects:

Biology, 02.08.2019 15:30


English, 02.08.2019 15:30


Chemistry, 02.08.2019 15:30

Geography, 02.08.2019 15:30


