NEED IT ASAP
The graph shows a proportional relationship between the c cups of
flour used and...

Mathematics, 12.02.2021 21:30 Amyra2003
NEED IT ASAP
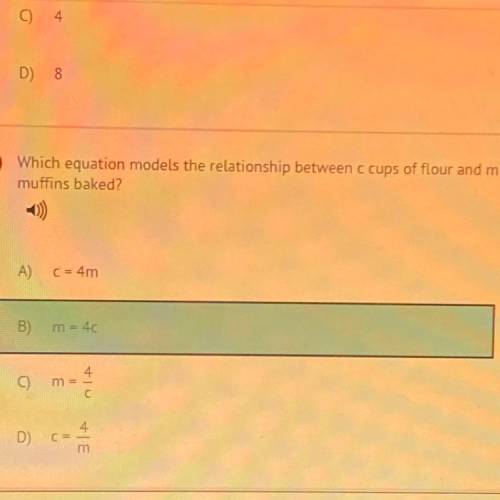
The graph shows a proportional relationship between the c cups of
flour used and the number of m muffins baked.
Identify the constant of proportionality from the graph. (The picture is the second part to the question)
A) 1
B) 2
C) 4
D) 8

Answers: 1


Other questions on the subject: Mathematics
Mathematics, 21.06.2019 19:30, noahdeem135
Asurvey of 2,000 doctors showed that an average of 3 out of 5 doctors use brand x aspirin. how many doctors use brand x aspirin
Answers: 1
Mathematics, 21.06.2019 23:00, jerseygirl3467
Can someone me with my math problems i have a bunch. i will give brainliest and lots of pleeeaaasssee
Answers: 2
You know the right answer?
Questions in other subjects:
SAT, 18.02.2022 06:00
Mathematics, 18.02.2022 06:00


Mathematics, 18.02.2022 06:00
History, 18.02.2022 06:00

Business, 18.02.2022 06:00


