
Mathematics, 12.02.2021 19:20 Jasten
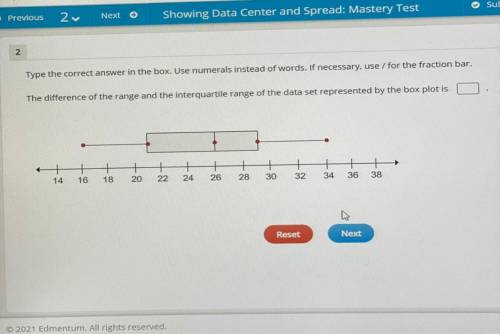
The difference of the range and the interquartile range of the data set represented by the box plot is
1
10
1
20
+
26
1
30
14
18
24
22
28
32
34
36 38

Answers: 2


Other questions on the subject: Mathematics
Mathematics, 21.06.2019 19:30, danielahchf
Ineed with angles and the measure of them i have abc a is 65 and b is (3x-10) and c is (2x) find the value of x
Answers: 2
Mathematics, 21.06.2019 20:30, qveenvslayin
Erin bought christmas cards for $2 each to send to her family and friends. which variable is the dependent variable?
Answers: 1
Mathematics, 21.06.2019 23:30, aherrerasmile1
Scenario: a rectangular plot of ground is 5 meters longer than it is wide. its area is 20,000 square meters. question: what equation will you find the dimensions? note: let w represent the width. options: w(w+5)=20,000 w^2=20,000+5 (w(w+5))/2=20,000 w+2(w+5)=20,000
Answers: 1
Mathematics, 22.06.2019 01:00, kat1357
You have just applied, and have been approved for a $58,000 mortgage. the rate quoted to you by the lender is 6.1% for a 30 year fixed mortgage. determine how much of your third month’s payment goes towards the principal. $56.65 $56.93 $57.22 $57.51
Answers: 2
You know the right answer?
The difference of the range and the interquartile range of the data set represented by the box plot...
Questions in other subjects:

Chemistry, 09.02.2021 21:40


History, 09.02.2021 21:40

Mathematics, 09.02.2021 21:40


