
Mathematics, 12.02.2021 18:50 Alexis3456829
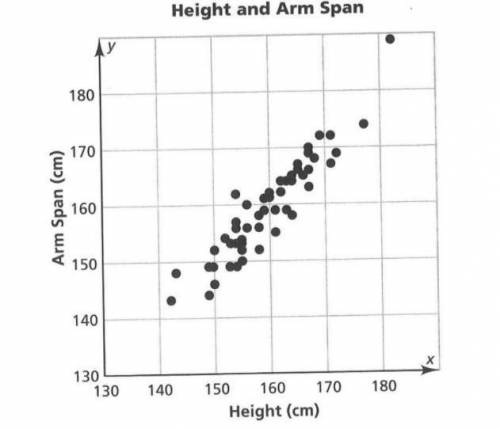
A group of 54 sixth-grade students measured their arm spans and their heights. Their data are shown in the scatter plot.
Use the scatter plot to answer the following questions.
1.) Find a trend line to model the data and add it to the scatterplot.
2.) How might you use this line to describe the relationship between height and arm span? (Describe the general relationship then discuss the correlation between the two variables and any other relationships that you notice. I’m looking for more than one sentence.)
3.) Write an equation for this line using for height and for arm span. Show work.
4.) What estimate would you give for the arm span of a sixth-grade student whose height is 165 cm? Explain your reasoning.
5.) What is true about the relationship between height and arm span for the points on the line? What is true for the points above the line? For the points below the line?

Answers: 3


Other questions on the subject: Mathematics
Mathematics, 21.06.2019 23:30, Kayteeortiz4593
Can someone me with my math problem pls my teacher is on my back about this
Answers: 2
You know the right answer?
A group of 54 sixth-grade students measured their arm spans and their heights. Their data are shown...
Questions in other subjects:

Chemistry, 01.03.2021 22:00
Mathematics, 01.03.2021 22:00


Health, 01.03.2021 22:00


