
Mathematics, 12.02.2021 17:20 senituliii
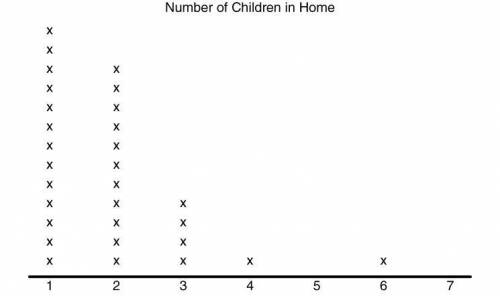
The following dot plot represents a random sample of elementary students and the number of children that live in their home. If this random sample is representative of elementary students in the United States, which of the following inferences can be made from the data? Select all that apply. The majority of the households in the United States, with at least one child, contain less than three children. Very few households in the United States contain four or more children. All households in the United States contain at least one child. None of the households in the United States contain five children.

Answers: 2


Other questions on the subject: Mathematics
Mathematics, 21.06.2019 16:30, jagdeep5533
Which function is odd check all that apply a. y=sin x b. y=csc x c. y=cot x d. y=sec x
Answers: 1
Mathematics, 21.06.2019 21:00, SiegeHatake4534
Rewrite the following quadratic functions in intercept or factored form. show your work. y = x^2 + 7x + 10
Answers: 2
Mathematics, 21.06.2019 21:30, achsahjosey
Acyclist bike x distance at 10 miles per hour .and returns over the same path at 8 miles per hour. what is the cyclist average rate for the round trip in miles per hour ?
Answers: 1
You know the right answer?
The following dot plot represents a random sample of elementary students and the number of children...
Questions in other subjects:


Spanish, 20.09.2019 09:10

History, 20.09.2019 09:10
History, 20.09.2019 09:10
Mathematics, 20.09.2019 09:10

History, 20.09.2019 09:10


