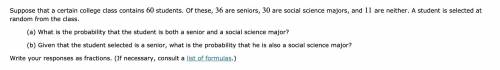
Can you help me solve the problems on the screenshot
...

Mathematics, 12.02.2021 14:00 madisonnewby5021
Can you help me solve the problems on the screenshot

Answers: 3


Other questions on the subject: Mathematics
Mathematics, 21.06.2019 17:10, ivilkas23
The frequency table shows a set of data collected by a doctor for adult patients who were diagnosed with a strain of influenza. patients with influenza age range number of sick patients 25 to 29 30 to 34 35 to 39 40 to 45 which dot plot could represent the same data as the frequency table? patients with flu
Answers: 2
Mathematics, 22.06.2019 01:00, myasiaspencer
If log(a) = 1.2 and log(b)= 5.6, what is log(a/b)? a. 4.4b. 6.8c. not enough informationd. -4.4
Answers: 1
You know the right answer?
Questions in other subjects:


Mathematics, 29.06.2019 02:00

English, 29.06.2019 02:00


History, 29.06.2019 02:00


